E-commerce · Operations Analytics · Product-led Systems
FillTrack — Delivery Operations Support
Context
Product team operating in a high-volume e-commerce environment where delivery data is spread across multiple systems and difficult to translate into operational priorities.
Scope
Scenario-based exercise using public dataset; designed to reflect enterprise decision workflows.
Problem
Teams lacked a shared, decision-ready view of delivery performance to monitor service quality,
identify risks early, and align operational decisions.

My Role
Product analytics & UX-led dashboard design translating business and regulatory/ operational goals into KPI definitions, decision-ready views, and documentation.
Key Decisions
Defined decision-ready operational KPIs ( service level, delays, returns) instead of raw metrics.
Structured dashboards around executive,
operational, and diagnostic views
Prioritized comparability and
prioritization over exhaustive detail
Outcome
Improved visibility into delivery performance and risk areas
Enabled faster operational decision-making
Supported alignment across operations, product, and CX teams
Decision Impact Summary
Key Insight
Delivery issues were not driven by isolated incidents, but by recurring performance patterns across regions, categories, and delivery modes, which were obscured by fragmented operational reporting.
Decision Supported
Enabled operations and product teams to prioritize delivery improvements, anticipate service-level risks, and align execution decisions based on comparable, trend-based KPIs rather than raw operational metrics.
Business Impact
Improved execution predictability and cross-team alignment by providing shared operational signals, supporting faster prioritization, reduced escalation costs, and more consistent customer experience in high-volume environments.
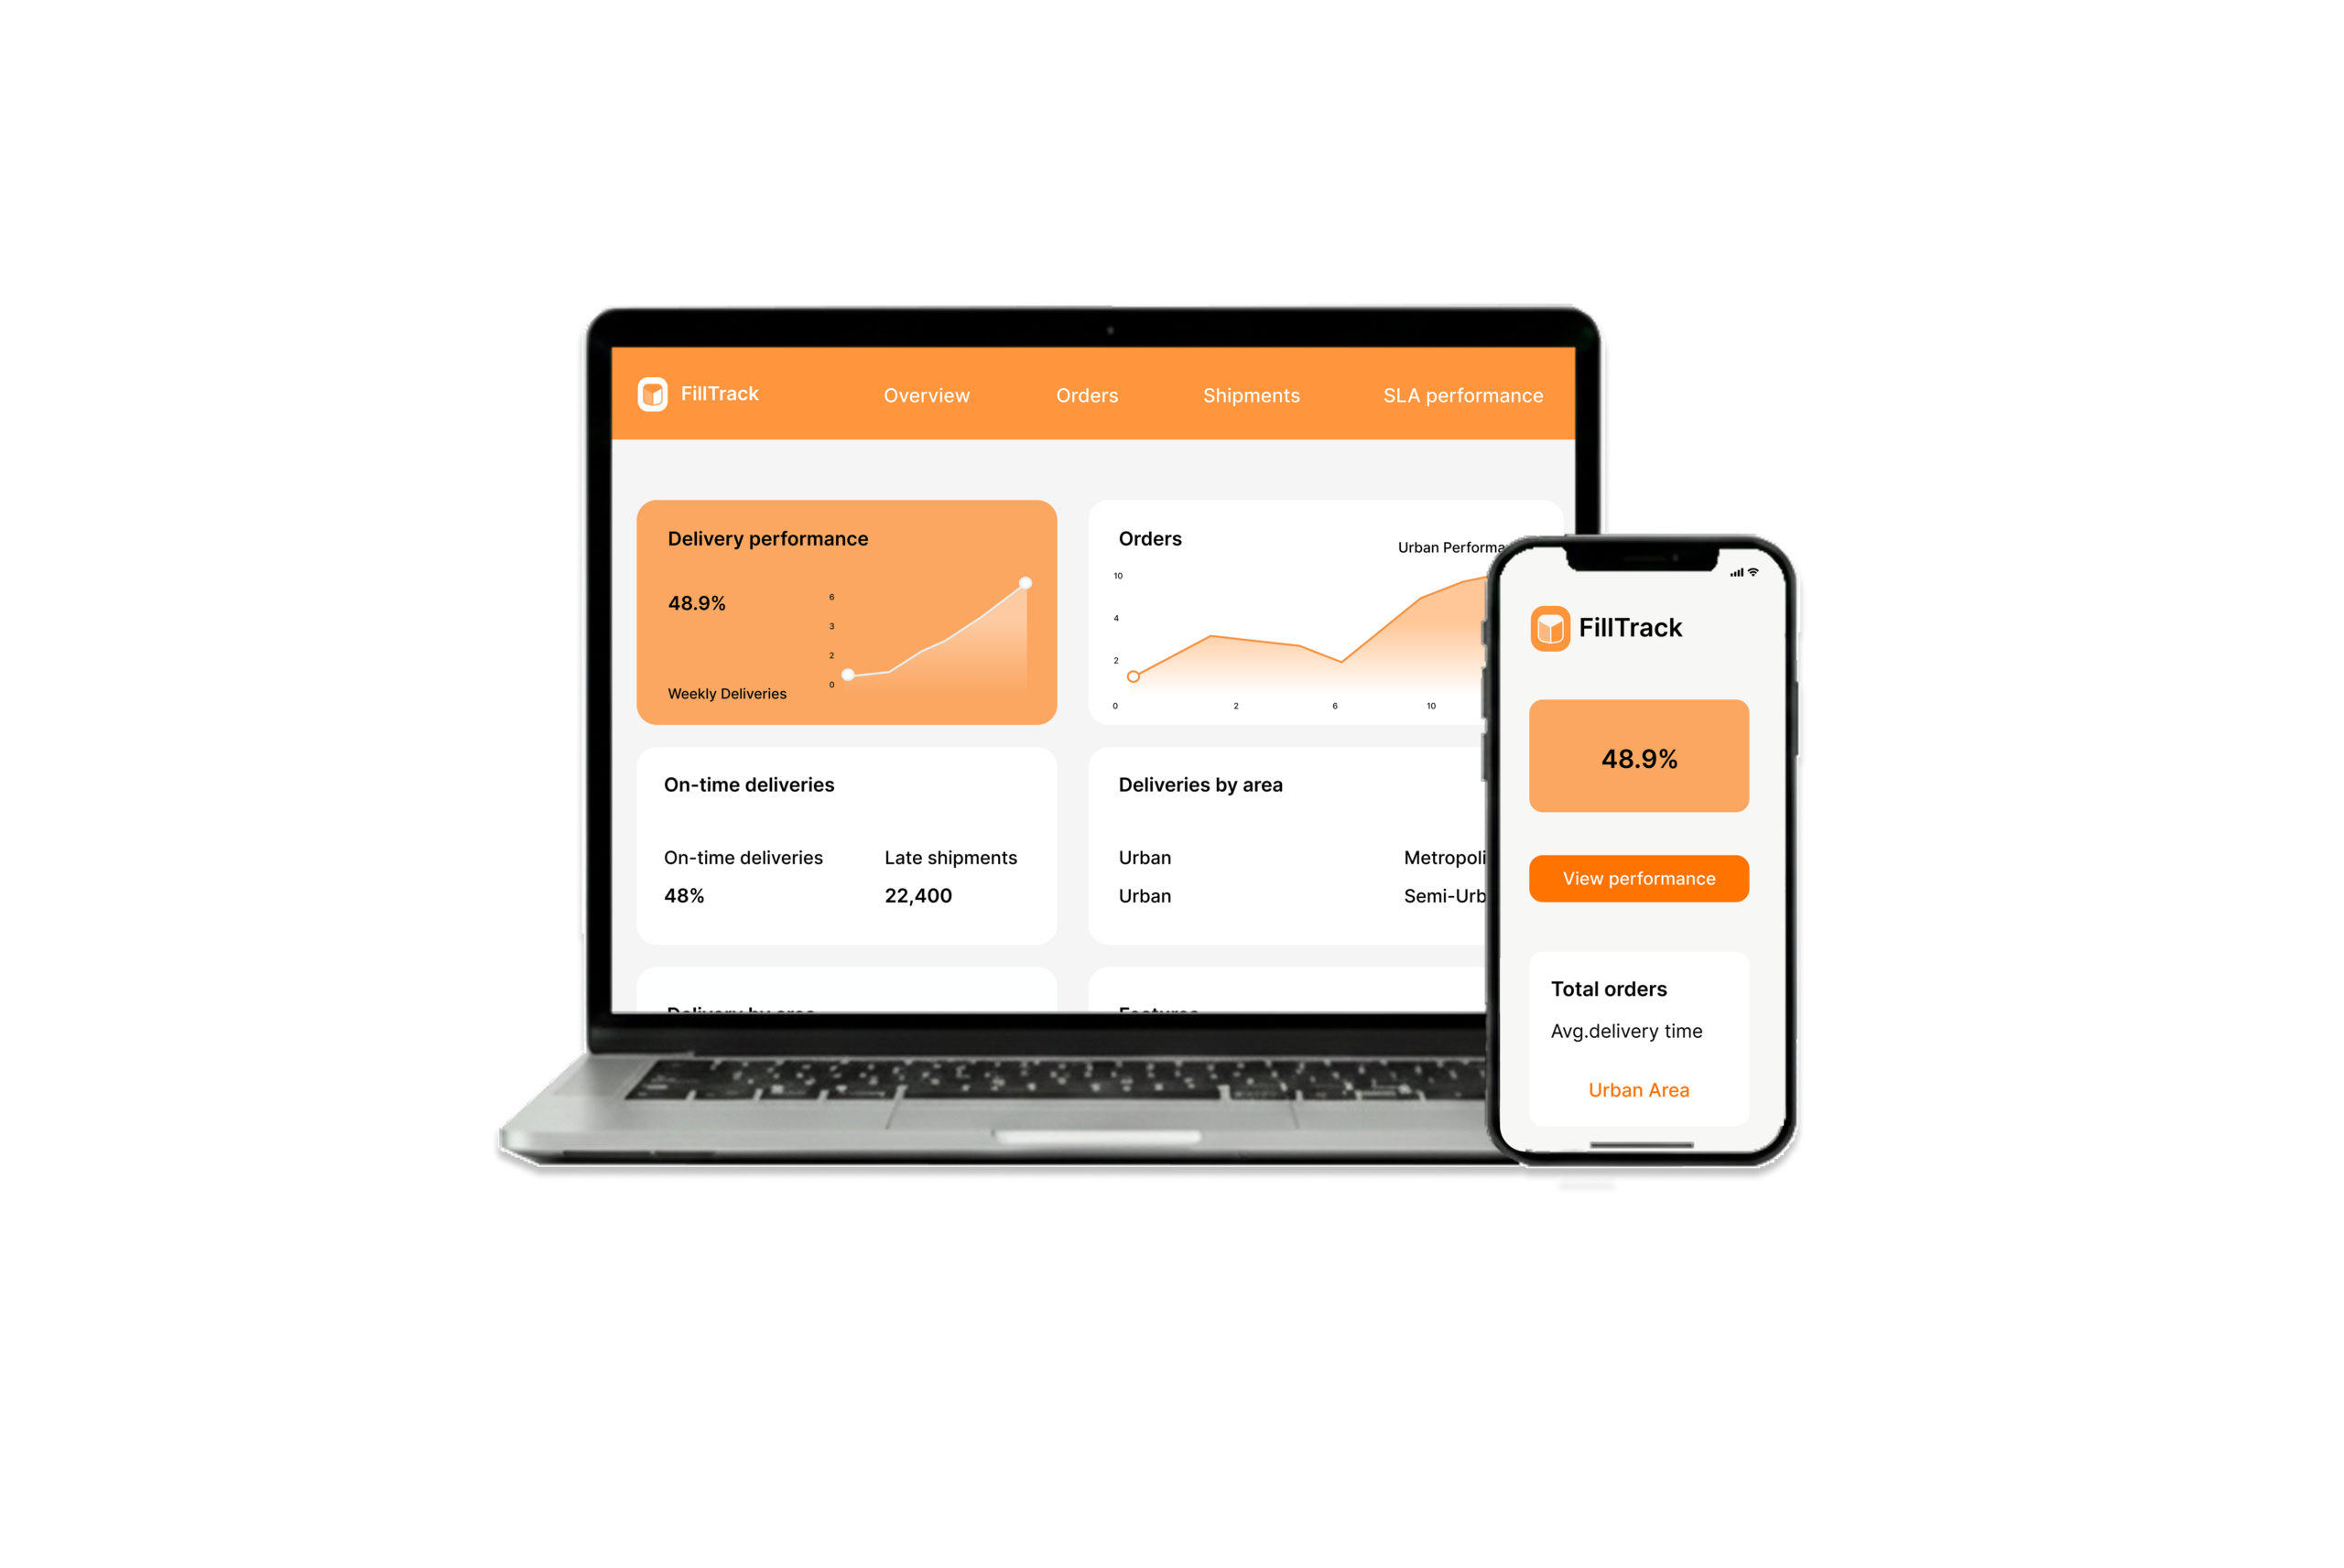
UX Dashboard
UX Strategy & Dashboard Architecture
FillTrack is structured into three purpose-driven views, reflecting real operational workflows.
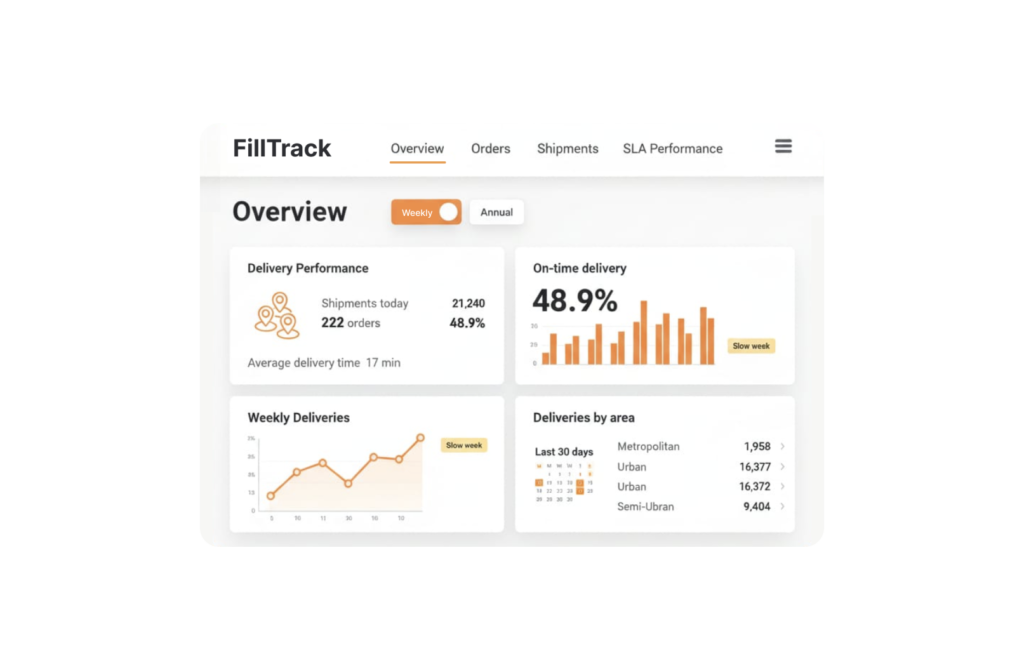
Executive Overview — Performance Snapshot
For leadership and decision-makers who need clarity in seconds.
Performance trends at a glance
Total deliveries
Average delivery time
Fastest category / slowest area
On-time rate
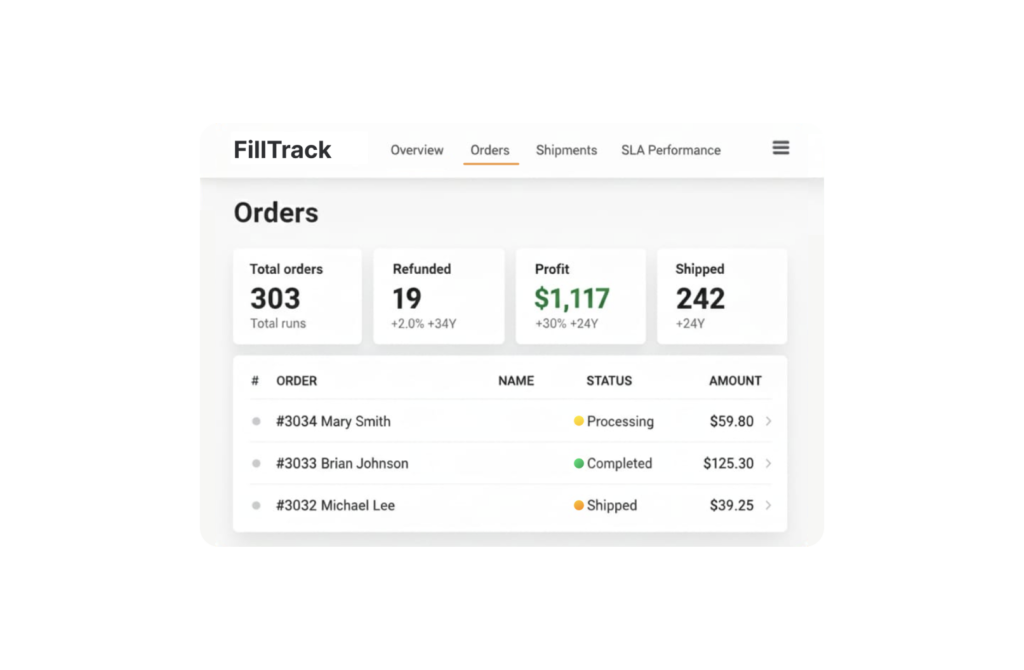
Orders — Operational Detail
For day-to-day operations and exception handling.
Recent orders table
Orders shipped, refunded, returned
Late shipments
Area distribution
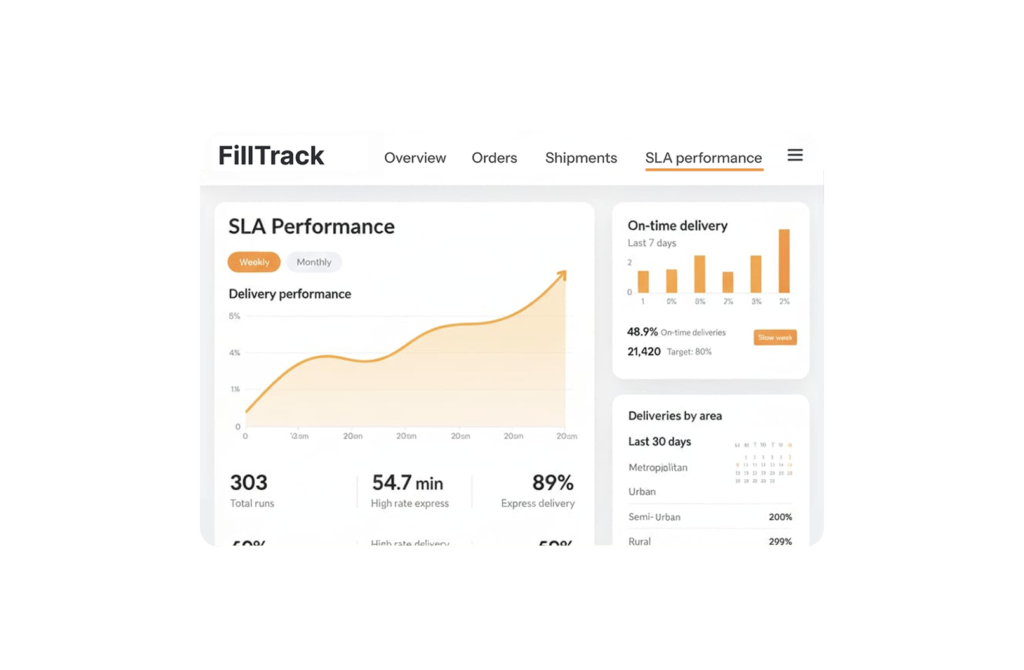
Performance — Trends & Benchmarks
For continuous improvement and strategic planning.
KPI diagnostics panel
Weekly and monthly performance trends
Delivery time distribution
Express delivery metrics
Why it matters
Demonstrates how operational data becomes decision-ready when structured for
prioritization and execution in product-led, scale-driven organizations.
Applicable contexts
E-commerce · Logistics · Operations Analytics · B2B Platforms
Extended case details available upon request.